This post may contain affiliate links. If you make a purchase through these links, a commission may be earned at no additional cost to you. We only recommend products and services that have been personally tested and are believed to provide genuine value to our audience.
The Iran war is creating a higher-oil-prices portfolio problem that every investor needs to address right now. The conflict has effectively closed the Strait of Hormuz, the world’s most critical oil chokepoint, sending Brent crude toward $100 per barrel. Rising oil is pulling stock markets lower, spiking European energy bills, and creating a level of investor uncertainty not seen since the Gulf War of 1991. This guide explains exactly how high oil can go, why that is hitting your portfolio, and crucially, why this selloff is a buying opportunity.
Understanding the higher oil prices portfolio impact is the key to making the right investment decisions in the weeks ahead. The investors who navigate this correctly will not be the ones who panic; they will be the ones who understand the cycle and act systematically.
Why Oil Didn’t Spike to $100 Immediately, And Why It Will
In our initial analysis, we expected oil to jump to $90–$100 the moment war broke out. That did not happen. Instead, Brent crude rose to around $80 on the announcement. For the following three days, it traded sideways between $80 and $85.
The reason is now clear. Markets initially assumed a quick resolution, as the supreme leader was removed on the first day. As a result, traders underpriced the disruption. However, as the week progressed, the reality set in that the Strait will not be safe for shipping for a while.
Since then, oil has climbed to approximately $95 per barrel. The trajectory is pointing higher, not lower.
The Inventory Buffer Is Running Out
One factor has been temporarily suppressing prices. An estimated 100 million barrels of sanctioned crude are currently sitting on tankers near the South China Sea. This floating inventory has acted as a pressure valve.
However, this buffer is finite. If the conflict lasts more than roughly 10 days, that supply is absorbed. After that, the market faces a genuine structural shortfall with no easy fix.
Every day the Strait remains closed, the world loses an estimated 10 million barrels of oil supply. The floating inventory buffer lasts approximately 10 days at that rate.
Therefore, the single most important variable in the Iran war oil prices story is duration. The longer this conflict lasts, the higher prices will go.
Iran War High Oil Prices: How the Strait of Hormuz Drives the Surge
The Strait of Hormuz carries approximately 20 million barrels of oil per day. That is roughly one-fifth of global oil consumption moving through a narrow waterway between Iran and Oman.
Since the conflict began, that flow has effectively stopped. Iranian drone and missile threats have made the passage commercially uninsurable. Ships are not moving. While Tehran insists it has not formally closed the Strait, the practical effect is identical.
Saudi Arabia’s east-to-west pipeline can reroute up to 5 million barrels per day. All alternative routes combined add some additional capacity. Nevertheless, even with every workaround in place, roughly 10 million barrels per day remain stranded.
The United States has promised Navy escorts and insurance backing for vessels transiting the Strait. However, implementation will take considerable time. Meanwhile, Chinese vessels continue to transit the waterway, reportedly carrying drone components to Iranian forces. Whether Washington will block Chinese shipping, and thereby cut off Beijing’s primary oil supply, is a question markets are actively considering.
Key Market Data: Iran War Oil Prices and Equity Drawdowns
| Daily oil flow through the Strait of Hormuz | ~20M barrels |
| The estimated daily supply is now disrupted | ~10M barrels |
| Brent crude current price | ~$95 / barrel |
| MSCI World Index drawdown (current) | ~-5% |
| Qatar LNG facility status | SUSPENDED |
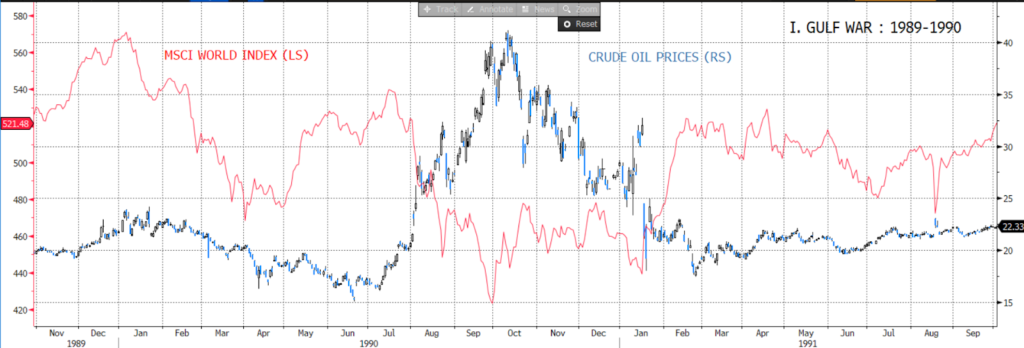
| Gulf War 1991: oil price peak | $40 (from $15) |
| Gulf War 1991: S&P 500 peak drawdown | -20% |
| Avg. geopolitical sell-off duration | 15 trading days |
| Avg. recovery to prior level | 16 trading days |
| S&P 500 avg. return 12 months post-crisis | +13% |
Europe’s Energy Crisis: Qatar’s LNG Shutdown Adds Another Shock
Oil is not the only commodity rattled by this conflict. The natural gas market has also taken a direct hit.
Qatar has suspended operations at its flagship LNG production facility, the world’s largest, due to the ongoing missile threat. This matters enormously for Europe. After Russia’s 2022 invasion of Ukraine, European governments spent years redirecting their energy supply chains toward Qatari LNG. That strategy has now been partially dismantled overnight.
European natural gas prices have spiked sharply in response. Production at the Qatari facility is expected to take at least a month to fully restore. Consequently, European utilities and consumers are facing a second major energy crisis in four years.
Furthermore, this creates a divergence between U.S. and European equity performance. American companies have less exposure to European gas prices and benefit from the U.S. being a significant oil exporter. As a result, U.S. stocks are currently outperforming European and Asian peers.
Iran War, High Oil Prices, History: What the Gulf War Tells Us
This is uncomfortable to say during a crisis. Nevertheless, history is consistent: geopolitical crises are almost universally better buying opportunities than they appear in real time.
Analyzing every major geopolitical shock since World War II, the data shows a clear pattern. The median equity sell-off lasts 15 trading days. The median time to recover to pre-crisis levels is just 16 more trading days. The average peak-to-trough decline is 5.7%. Moreover, the S&P 500 has averaged a 13% gain in the 12 months following the bottom of a geopolitical sell-off.
The most relevant comparison is the Gulf War of 1990–91. Oil rose from $15 to $40 per barrel. The MSCI World Index fell 25% at its worst point. However, investors who bought during peak fear were richly rewarded as the conflict resolved.
Currently, the MSCI World Index is down approximately 5% from its peak. That means there is potentially another 15% downside in a worst-case scenario, but also that a significant portion of the easy gains from buying at the bottom lie ahead.
Iran War Oil Portfolio Strategy: Three Scenarios and How to Act
Given current conditions, the dynamics of oil prices in the Iran war provide a clear framework for portfolio positioning. The key insight is this: use oil as your primary real-time signal, and scale into equities gradually rather than all at once.
Here are three specific scenarios and the appropriate response to each:
- Scenario 1 – Oil at $95 (current): Begin cautious, scaled entry into equities. Do not rush. The worst-case drawdown comparable to the Gulf War’s 20% decline remains possible. Start small and build gradually.
- Scenario 2 – Oil at $100, MSCI World at the 200-day moving average (-6.5%): Increase equity exposure more meaningfully. This level represents a statistically significant support zone. At this point, also begin taking partial profits on any long oil positions, as the risk/reward starts shifting.
- Scenario 3 – Oil at $120–$130, equities down 10–20%: This is the maximum fear scenario. Historically, this is precisely when aggressive buying of risk assets has generated the strongest subsequent returns. The long-term bull market drivers remain intact; this is a cyclical disruption, not a structural break.
Gradualism is the most important principle here. Investors who attempt to call the exact bottom consistently underperform those who scale in systematically across multiple entry points.
Additionally, consider the geographic opportunity. European and emerging market stocks are currently underperforming significantly. When this conflict resolves, those markets stand to benefit the most from a snapback. Therefore, investors with a longer time horizon should pay particular attention to discounted valuations in those regions.
Iran War Oil Portfolio Hedge: Gold and Bonds
Gold: Short-Term Pullback, Long-Term Case Intact
Gold initially rallied when the conflict broke out. Since then, it has pulled back as investors took profits. This should not be interpreted as a bearish signal.
The structural case for gold is strengthening, not weakening. The Trump administration has demonstrated a consistent pattern of military intervention in Venezuela, Iran, and, with Cuba, perhaps next. Each intervention adds to the geopolitical risk premium embedded in global markets. Over time, gold is the most direct beneficiary of this premium.
Furthermore, the current pullback appears to reflect profit-taking by financial investors who held long positions prior to the conflict. The underlying demand picture remains solid.
Bonds: Not the Hedge You Expected
Another expectation that did not materialize: the traditional flight-to-safety rally in U.S. Treasuries. Bond yields have actually risen since hostilities began. The reason is the inflationary signal embedded in higher oil prices.
If oil pushes toward $120–$130, some market participants will debate whether the Federal Reserve needs to raise interest rates. This narrative, if it gains traction, would be materially negative for both bonds and equities simultaneously. That combination of pain is precisely the environment that historically marks peak fear and the best buying opportunities.
Bonds may become more attractive as a hedge once oil peaks and begins declining, signaling de-escalation. For now, however, they are not providing the portfolio ballast most investors would expect.
How Long Will This Last?
Every analytical framework for this conflict ultimately returns to one question: how long does it last?
The case for a short resolution is credible. Iran’s Supreme Leader is reportedly dead. The Iranian Navy and Air Force have been largely destroyed. Economic pressure on Tehran is intensifying rapidly. Moreover, China, Iran’s most important trade partner, has a powerful incentive to broker a ceasefire, since the Strait closure directly threatens its own oil supply.
President Trump has publicly described this as a four-to-five-week campaign. That would suggest the end of US attacks by April. Markets are currently pricing something closer to the short end of that range.
Nevertheless, the risk of prolongation is real. Iran still has substantial stocks of short-range missiles and drones. Chinese drone component resupply reportedly continues. The fate of the Iranian Revolutionary Guard, whether it remains under central command or fragments into autonomous units, remains deeply uncertain.
In summary: the base case is weeks, not months. However, investors should be mentally and financially prepared for the scenario where this extends further.
THE BOTTOM LINE
The Iran war oil prices story is the defining market event of early 2026. The conflict is disrupting approximately 10 million barrels of oil supply daily. It has shut the world’s largest LNG facility. It has pushed European gas prices sharply higher. And it has created the kind of equity-market uncertainty that, historically, has produced outstanding entry points for patient investors.
Watch oil as your primary real-time signal. Use $95, $100, and $120+ as the three escalating triggers for increasing equity exposure. Maintain gold exposure as a structural geopolitical hedge. And remember: the shared interest of the U.S., Gulf states, Israel, and China in keeping the Strait open is ultimately the most powerful force working toward resolution.
This is not the time to panic. It is time to build a systematic plan and execute it with discipline.
Which Instruments You Can Buy in a Correction
- iShares Core MSCI World UCITS ETF | SWDA (for EU citizens, BlackRock, World stock market index).
- iShares MSCI World ETF | URTH (BlackRock, World stock market index).
Where to Build Your Portfolio
You can position your portfolio through the following broker platforms:
REVOLUT:
Easiest option for retail investors. Simple interface, quick access to ETFs, stocks, and commodities.
Trading212:
User-friendly platform offering commission-free stock and ETF investing. Suitable for retail investors seeking straightforward access to global markets.
INTERACTIVE BROKERS: The most professional global trading platform
Most professional global trading platform. Broad asset access, including equities, bonds, futures, commodities, and advanced trading tools.
Disclaimer
This article represents market analysis and editorial opinion. It does not constitute personalized financial advice. Past performance during geopolitical crises does not guarantee future results. Please consult a qualified financial advisor before making investment decisions.